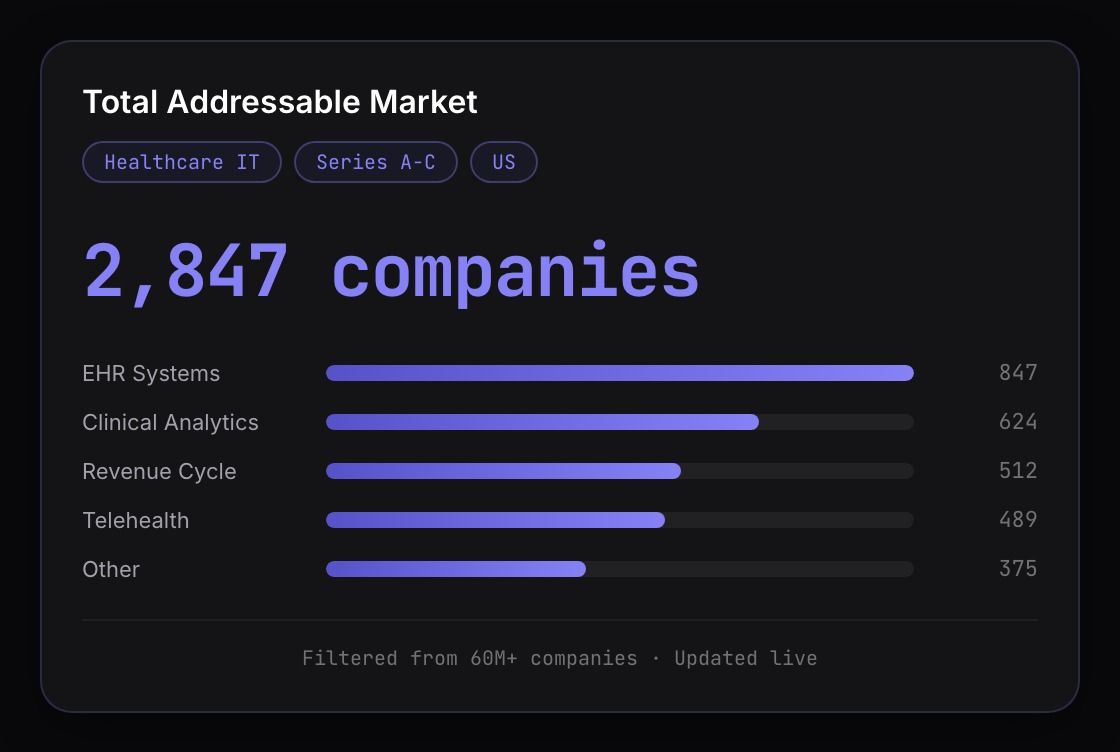
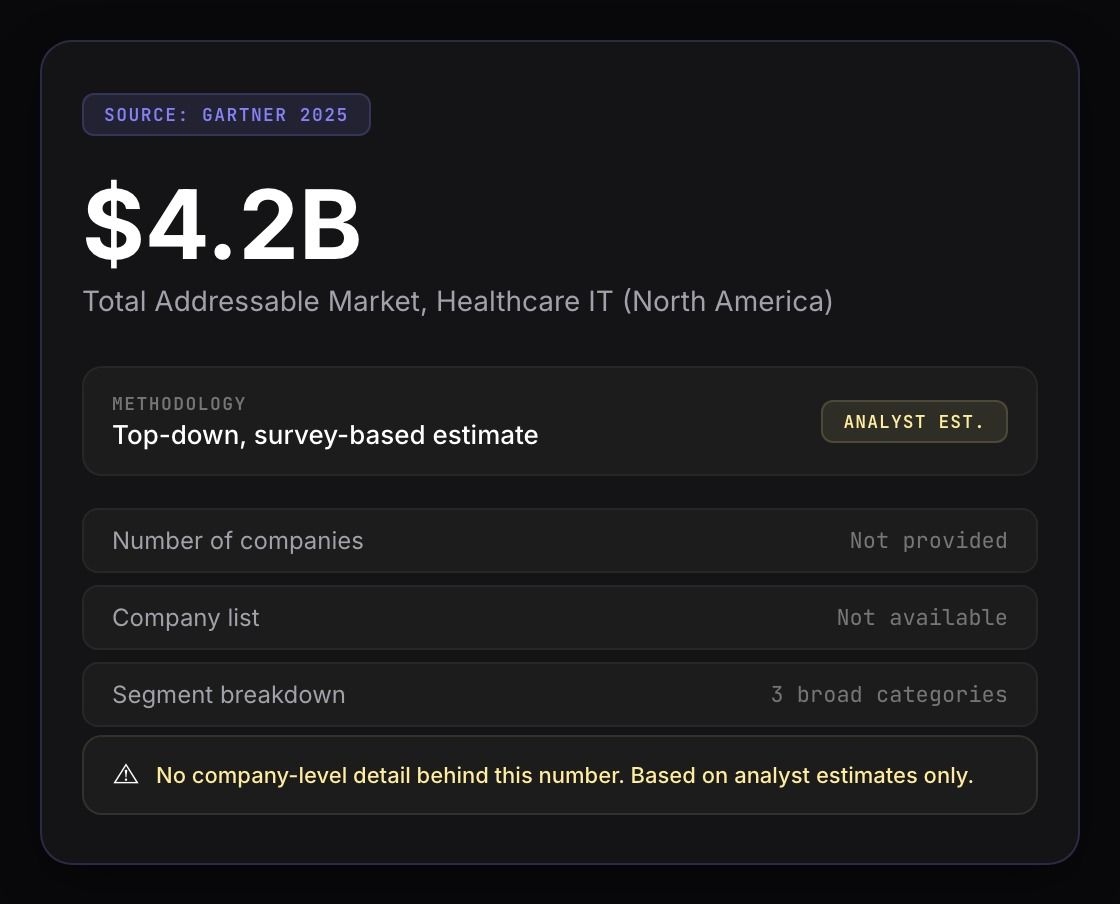
Analyst reports give you a top-down TAM number you cannot verify. Search 60M+ companies by industry, headcount, funding stage, and geography to build bottom-up models with actual company counts.


| Today | With Crustdata |
|---|---|
| Analyst reports give a top-down dollar figure with no company-level detail. | Filter 60M+ companies by industry, headcount, funding, and geography to get an exact count. |
| Bottom-up TAM requires stitching Crunchbase, PitchBook, and manual research. | One query with 95+ filter dimensions returns every matching company in seconds. |
| Segment definitions are inconsistent across data sources. | Define your own segment criteria and get a count you can defend with a list of names. |
| TAM models decay because nobody re-runs the manual collection process. | Re-run the same query next quarter with live data. The count updates automatically. |
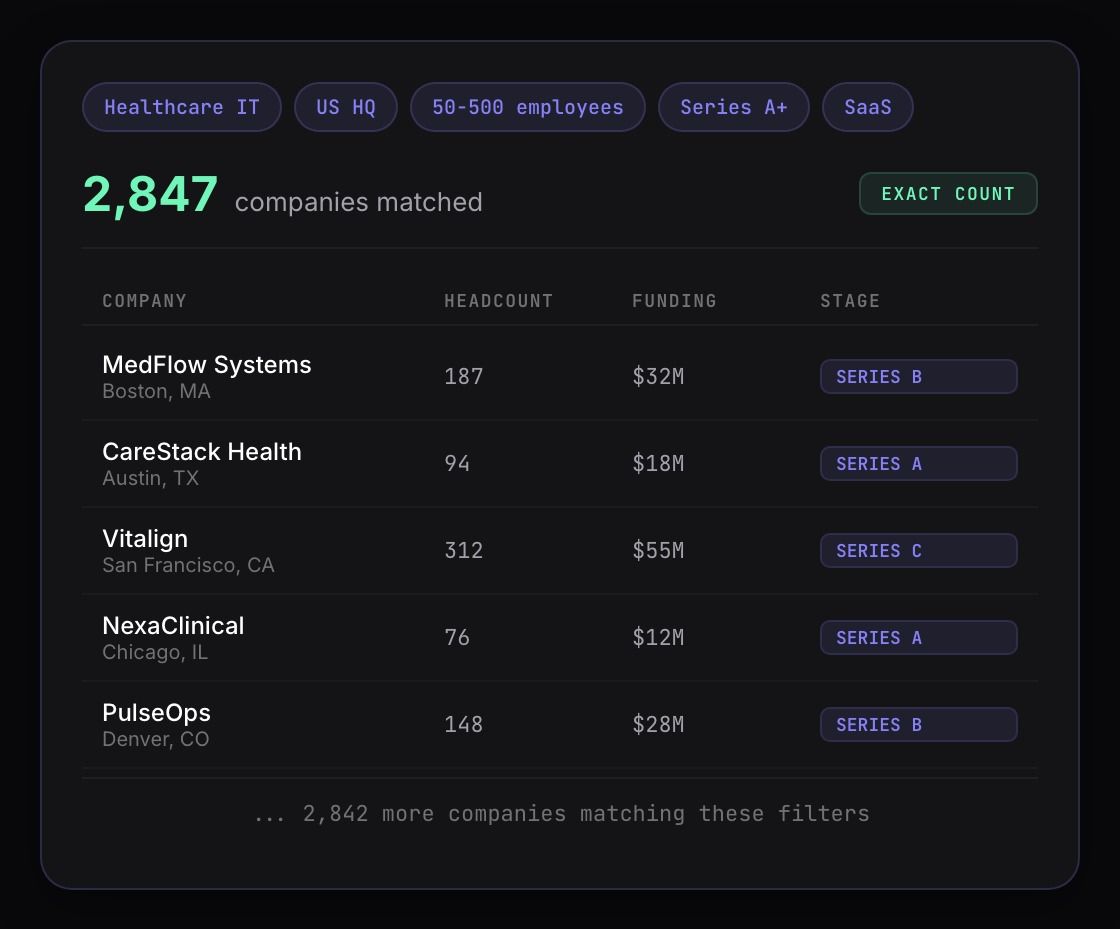
Define your market by industry, employee count range, funding stage, geography, and growth rate. The API returns every matching company with firmographics, headcount, and funding details.
1 credit per 100 results.


Pick any company from your TAM results and pull 250+ live datapoints: headcount trends, funding history, revenue estimates, web traffic, hiring activity, and leadership.
1 credit per company.
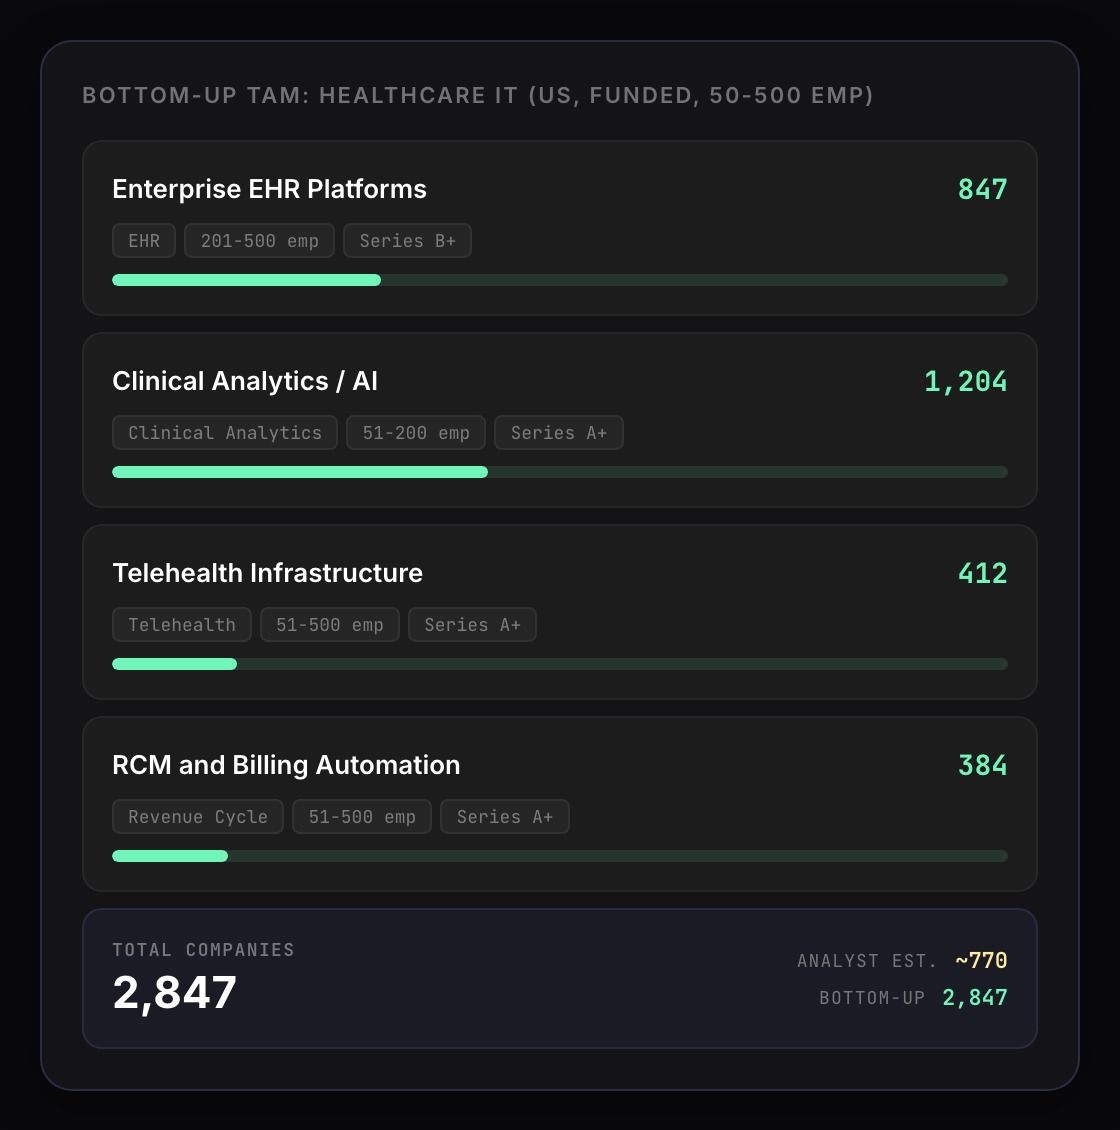
Every segment shows an exact company count, and anyone on the team can click through to the list of names behind it.
Crustdata indexes 60M+ companies across all geographies, industries, and stages.
Yes. The Company Search API supports 95+ filter dimensions including headcount growth rates, funding recency, revenue estimates, web traffic, and hiring activity.
Company search is 1 credit per 100 results. Enrichment is 1 credit per company. A TAM model covering four segments with 3,000 total companies costs roughly 30 credits for search and 3,000 for full enrichment.
PitchBook and Crunchbase cover funded companies well but do not let you filter by headcount growth, revenue estimates, hiring velocity, or web traffic in a single query.