Technographic Data Providers: How They Compare and How to Choose
Technographic data reveals the software and infrastructure a company uses. This guide explains what it is, how providers detect it (web crawling, job postings, self-reported), and how the main technographic tools compare on coverage, freshness, pricing, and API access so you can pick the right one.
Published
Written by
Chris P.
Reviewed by
Nithish A.
Read time
10
minutes
Technographic data tells you which software, platforms, and infrastructure a company uses. It answers a specific question sales and marketing teams keep asking. Does this account use the tools that make my product a fit, and are they showing signs of adopting or replacing something in that category.
We see the demand for this data up close. Across the teams that came to us at Crustdata for company data, 133 of them asked for technographic data, which makes it the single most-requested capability we track. That is worth stating plainly at the top, because most buying guides describe technographic data as a nice-to-have. In our experience it is closer to a must-have, and teams walk away when they cannot get it.
Data providers get this information in different ways. Some crawl company websites for front-end code (BuiltWith, Wappalyzer). Some read job postings and public web signals to infer the backend and internal tools a crawler never sees (TheirStack, PredictLeads, Crustdata). Others blend licensed data, contributor networks, and intent signals into a broader sales-intelligence platform (ZoomInfo, Cognism, 6sense). The right choice depends on which technologies you care about, how fresh the data needs to be, and how you plan to deliver it into your workflow.
This guide covers what technographic data is, how it gets collected, how the main providers compare, and how to choose between them.
What Is Technographic Data?
Technographic data is information about the technology a company uses. That includes its website stack (CMS, analytics, tag managers, chat widgets), its business software (CRM, marketing automation, help desk, data warehouse), its cloud and infrastructure providers, and, with some sources, signals about spend, contract timing, or hiring intent around a given tool.
Sales and marketing teams use it to build better target lists and to time outreach. If you sell a Salesforce integration, a list of companies that run Salesforce is worth more than a raw firmographic list. If a company is hiring engineers who know a competing platform, that is a signal worth acting on before the switch is public.
Technographic vs firmographic data
Firmographic data describes what a company is, its industry, headcount, revenue, location, and funding. Technographic data describes what a company runs, the specific tools and platforms in its stack.
The two work together. Firmographics narrow the field to companies that look like your customers. Technographics sharpen that field to the companies that use, or are moving toward, the technologies that make your product relevant. Most modern go-to-market motions layer them, using firmographic filters for the shape of the account and technographic filters for fit and timing. A few providers, Crustdata among them, return both in a single company record so you do not have to stitch two sources together.
How Is Technographic Data Collected?
Every provider is really a detection method plus a delivery layer. Understanding the method matters, because each one is strong on some technologies and blind to others. This is the section most buyers skip and later regret skipping.
One pattern is worth flagging before the methods, because it shaped what teams actually asked us for. Of the teams that requested technographic data from us, the most common request was not for a website crawl at all. It was to infer a company's tech stack from its job postings. The recurring phrasing was some version of "figure out what they run from what they are hiring for." That preference is the reason the two methods below are not interchangeable, so it is worth reading them with that buyer signal in mind.
Website and web-crawl detection
Crawlers visit a company's public web pages and read the source for script tags, tracking pixels, CSS frameworks, DNS and hosting records, and other fingerprints left by front-end technology. BuiltWith and Wappalyzer are the reference tools here.
Strengths: broad, cheap to run at scale, and accurate for anything that touches the front end (analytics, tag managers, chat, ecommerce platforms, CDNs, CMS).
Limits: a crawler only sees what the website exposes. Backend databases, internal CRMs, data warehouses, and most SaaS the company uses privately leave no public web fingerprint, so crawl-only sources tend to under-report the internal stack.
That limit is exactly what buyers kept raising with us. Teams came in already running a web-crawl tool and told us its data was sparse on the systems they cared about, the backend and internal ones a crawler cannot reach. Which leads to the second method.
Job-posting and public-signal inference
This method reads job descriptions and other public text (careers pages, engineering blogs, public repos) and infers the stack from what a company is hiring for and writing about. A posting that asks for "experience with Snowflake and dbt" is strong evidence those tools are in use, even though neither appears on the corporate website. TheirStack, PredictLeads, Coresignal, and Crustdata's Technographics feature sit in this class.
This is the method our own buyers asked for most often, by name. When teams described the tech stack data they wanted, they overwhelmingly described inferring it from job postings rather than crawling a homepage, because that is where the systems they sell around actually surface. One buyer running a research platform told us they already stitch together several tools at once, pulling from BuiltWith, Coresignal, and a handful of web and news sources, mainly to answer one question about a target account, what does their tech stack look like, and are they hiring the people who run it. The hiring signal was the part they trusted.
Strengths: catches backend and internal tools that web crawlers miss, and job postings double as a timing signal (hiring for a tool often precedes or accompanies adoption).
Limits: inference is probabilistic, coverage depends on a company posting jobs and mentioning tools by name, and results need normalization so "GCP," "Google Cloud," and "Google Cloud Platform" resolve to one entity.
Self-reported and contributor networks
Some data comes from the companies themselves or from a network of participating sites and apps. Intent cooperatives such as Bombora aggregate research behavior across a publisher network. Enrichment tools capture technology at the moment a user fills out a form. Self-reported data can be timely and first-party, but its coverage is bounded by who participates in the network.
Licensed and blended sources
Larger platforms rarely rely on one method. ZoomInfo, Cognism, 6sense, and HG Insights combine crawling, licensed third-party datasets, contributor data, and their own research, then apply verification on top. Blending widens coverage and supports compliance and accuracy claims, at the cost of transparency about where any single data point came from.
AI and machine-learning inference
Most providers also run models on top of the raw signals to clean the data, merging duplicates, matching records to the right company, and filling gaps where no direct signal exists. This widens coverage, but it is worth knowing the difference between a tool a provider actually saw and one it guessed at. A tool that was directly detected, a script found on the live website or a tool named in a job posting, is a confirmed fact. A tool that was inferred from indirect clues is a best guess, not a confirmed sighting. Good providers label which is which, so you know how much to trust each entry.
The practical takeaway: no single method sees everything. Web crawlers own the front end, job-posting inference owns the backend and internal tools, and blended platforms trade transparency for breadth. Match the method to the technologies you actually sell around, and note that when buyers get to choose, they lean toward the job-posting signal for anything past the website.
Technographic Data Providers Compared
The table groups providers by their primary detection method. "Coverage" figures are provider-stated where published; treat them as directional, since providers count technologies differently.
Provider | Detection method | Coverage (stated) | Freshness | Integrations / API | Starting price | Best for |
BuiltWith | Web crawl / code analysis | 123,000+ technologies | Periodic re-crawl | Web app, CSV, API, Chrome extension | $295/mo | Website-tech targeting, TAM by web stack |
Wappalyzer | Web crawl / code analysis | Thousands of technologies | On-lookup | API, CRM connectors, free browser extension | Free tier; paid from $250/mo | Lightweight website-tech lookups |
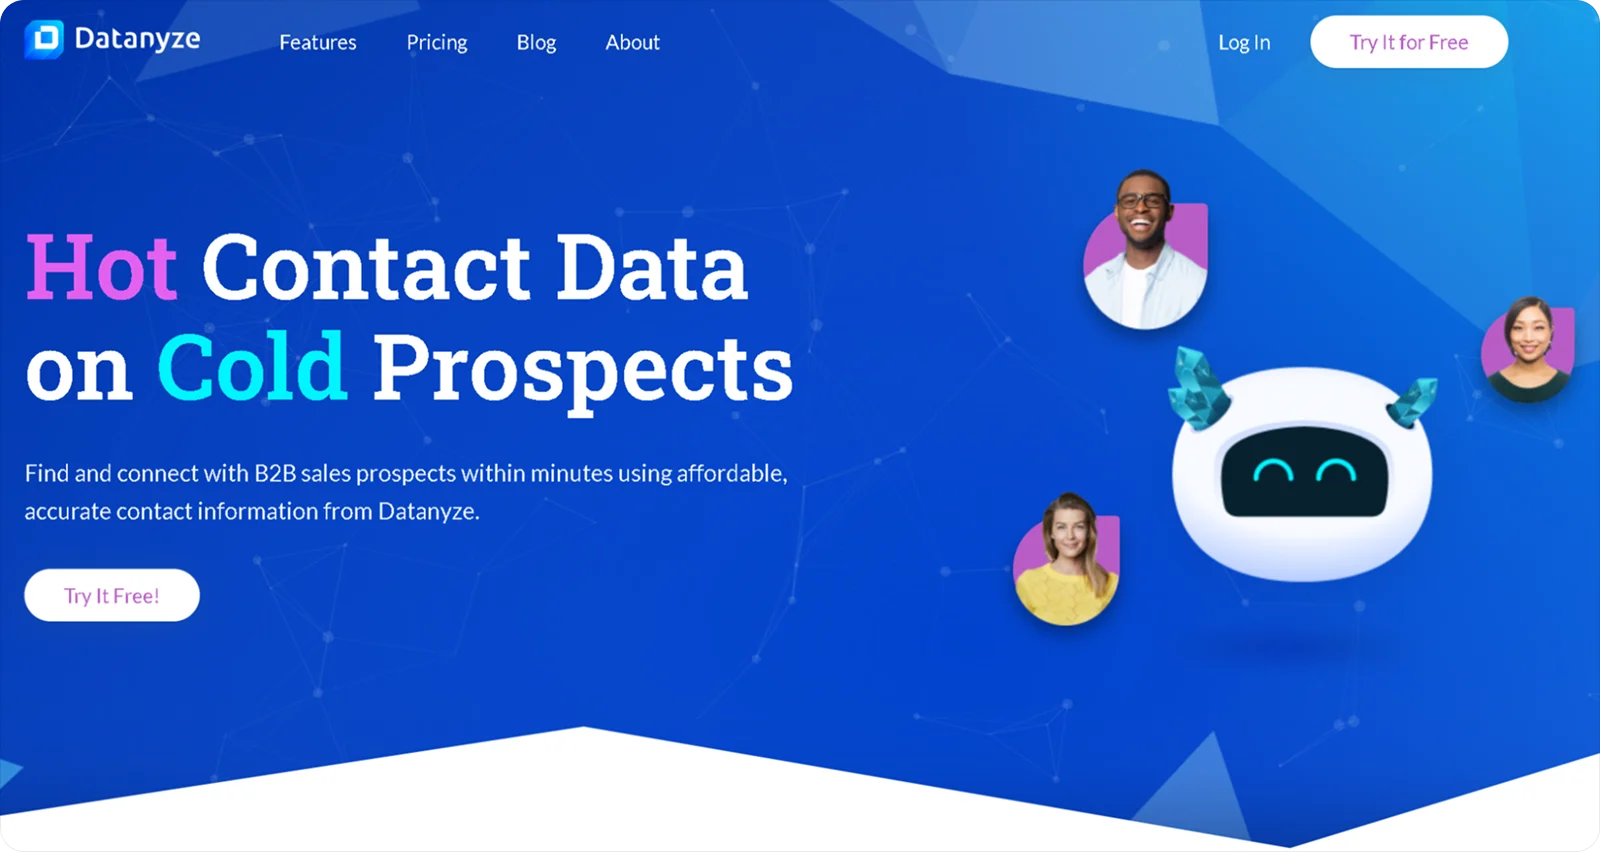
Datanyze | Web technology detection | 31,000+ technologies across 35M+ sites | On-demand | Chrome extension, CSV | Free trial; from $29/mo | Individual reps doing on-the-fly lookups |
Crustdata | Job postings + public web signals | 5M+ companies mapped to tech stack | From continuously updated public signals | API-first (Company Enrich, Batch Enrich, Company Search, Autocomplete) | Usage-based add-on | API and automation workflows needing firmographic + technographic together |
TheirStack | Job-posting NLP | 32,000+ technologies from 351k+ sources | Frequent updates | API, CSV | Free tier; from $59/mo | Detecting backend tools crawlers miss |
PredictLeads | Job postings + company signals | 54,000+ technologies across 120M+ companies | Job data refreshed ~every 36h | API, flat files, webhooks | Custom (free tier 100 requests/mo) | Signal-led prospecting and triggers |
Coresignal | Multi-source + job extraction | 103M company records, tech from job data | New jobs every 6h; monthly refresh | Company / Employee / Jobs APIs, bulk datasets | From $49/mo (API), $1,000 (datasets) | Data teams building their own models |
ZoomInfo | Verified/licensed + crawling | 30,000+ technologies across 100M+ companies | ~90% of pairings under 3 months old | CRM, sales engagement, API | Custom (commonly $15k+/yr) | Enterprise sales teams |
Cognism | Licensed + verified blend | ~20,000+ technologies (secondary layer) | Ongoing refresh | CRM, API | Custom (platform from ~$15k/yr) | Compliance-focused EU/US outbound (GDPR) |
Apollo.io | Blended platform data | Technographic filters within a sales database | Ongoing refresh | CRM, sequences, API | Free tier; from ~$49/user/mo | SMB and mid-market all-in-one prospecting |
Clearbit (HubSpot Breeze Intelligence) | API enrichment | Software and cloud signals (lighter depth) | At time of enrichment | Native HubSpot, API | Requires HubSpot; credits from ~$45/mo | Product-led growth on HubSpot |
Bombora | Intent cooperative | 13,000+ topic categories (intent, not installs) | Weekly intent surges | CRM, ABM platforms, API | Custom (commonly $30k+/yr) | Intent-led ABM |
6sense | AI intent + tech | 30,000+ technographics; 65M+ companies | Continuous scoring | CRM, ABM, API | Custom (~$55k to $130k+/yr) | Enterprise marketing ABM |
Demandbase | Blended + intent | 47,000+ technologies across 136M+ domains | Ongoing refresh | CRM, ABM, API | Custom (~$24k to $65k+/yr) | Enterprise ABM platforms |
HG Insights | Licensed + research | 12M+ orgs, 32,000 IT contracts, spend forecasts | Ongoing research refresh | RGI platform, API, connectors | Custom (~$12k to $90k/yr) | Enterprise IT spend and contract intelligence |
The Providers in Detail
Detailed profiles grouped by detection method. Each covers what the tool is, how it detects technology, its scale and freshness, how the data is delivered, its pricing, and who it fits best.
Website and web-crawl specialists
BuiltWith
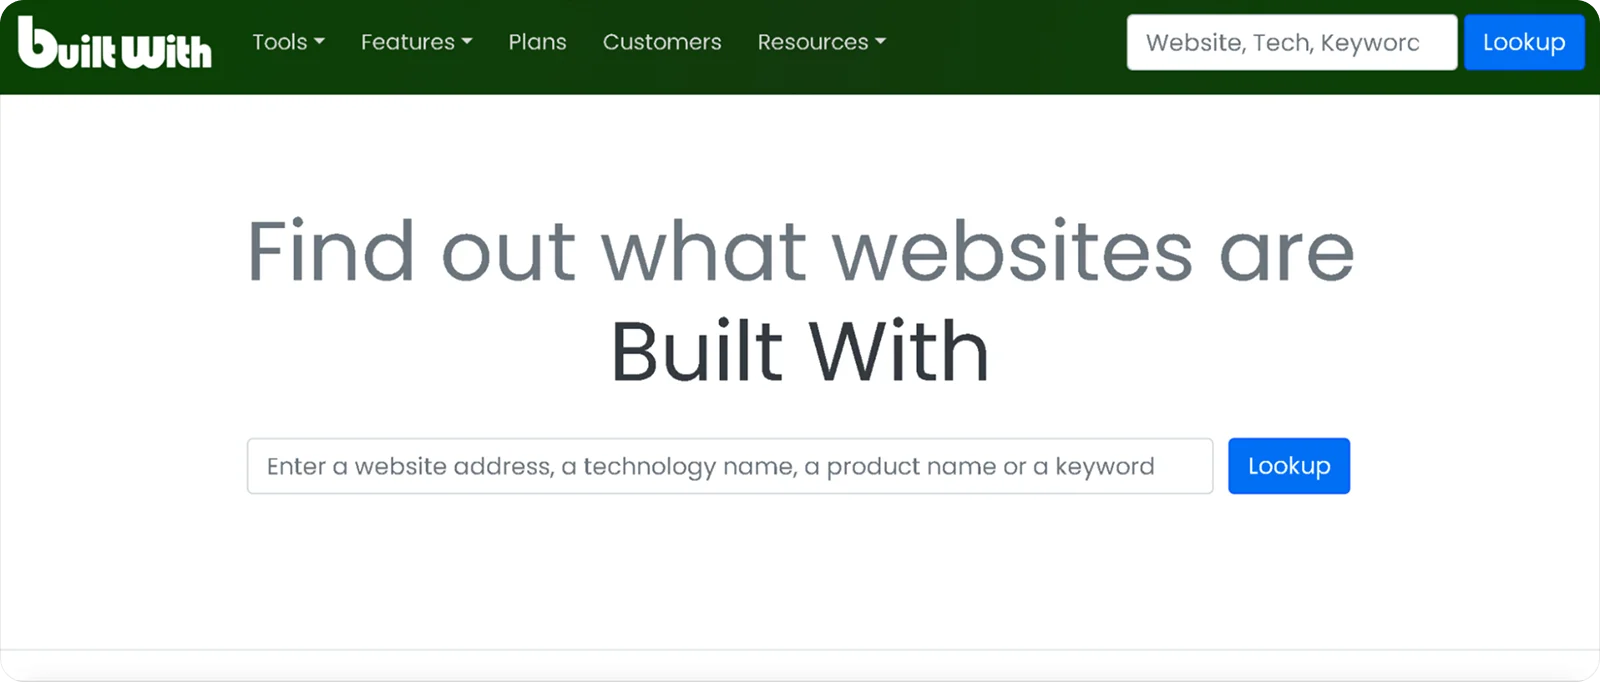
Crawls hundreds of millions of websites and reads their code to identify the technologies each site runs, covering more than 123,000 technologies across analytics, advertising, hosting, CMS, ecommerce, and widgets.
One of the deepest catalogs for website-facing technology. It turns that catalog into lead lists filtered by web stack, so a team can pull every site running a given tool.
It is the tool buyers name most when they come to us looking to switch or supplement. The recurring point is not that BuiltWith is inaccurate on what it sees, it is that teams find the data sparse on the internal and backend stack, the part a crawler cannot reach. That is a fair read of any crawler, not a knock on BuiltWith specifically.
Individual site lookups are free. Subscription plans start at $295/month for Basic, then $495 for Pro and $995 for Team.
Best for teams whose targeting hinges on public website technology.
TechPeeker
TechPeeker is a strong BuiltWith alternative for businesses looking to identify the technologies used by websites and build targeted prospect lists, with detectors for CMS, ecommerce platforms, and web apps across millions of sites.
Pairs tech detection with built-in lead generation, so a team can go from a technology filter to an enriched prospect list in one tool, with API access for enrichment pipelines.
Like any crawler, coverage is the public web-facing stack, so it does not see internal or backend tools.
Best for agencies and outbound teams that want technographic targeting and lead lists in one place.
Wappalyzer
Reads a website's code and network requests to identify the technologies a site runs, covering CMS, web frameworks, ecommerce platforms, analytics, and JavaScript libraries.
Started as a free browser extension and still offers one, alongside an API and CRM connectors that let teams qualify accounts, build lead lists, and enrich records from a domain.
Coverage is the public web-facing stack only, so it does not see internal or backend systems. It also does not publish a single technology count on its live pages, so treat precise numbers with caution.
A free account allows 50 lookups a month. Paid plans start at $250/month for Pro, then $450 for Business and $850 and up for Enterprise.
Best for teams that want quick, website-facing technology lookups through a simple API or extension rather than a full sales platform.
Datanyze
Identifies the technologies a company uses while you browse its website or LinkedIn profile, surfacing the web-facing stack in a Chrome extension, and pulls basic contact details as you go.
Reports coverage of more than 31,000 technologies across roughly 35 million websites. Now owned by ZoomInfo, it runs as a standalone, credit-based extension aimed at light prospecting rather than bulk enrichment.
Data comes out through the extension and CSV export, so it fits a manual workflow more than an automated pipeline.
A free trial gives 10 credits a month for three months. Paid plans start at $29/month for Pro 1 with 80 credits, then $55/month for Pro 2.
Best for individual reps who want fast, in-browser technology lookups on the accounts they are already viewing.
Job-posting and public-signal detection
Crustdata
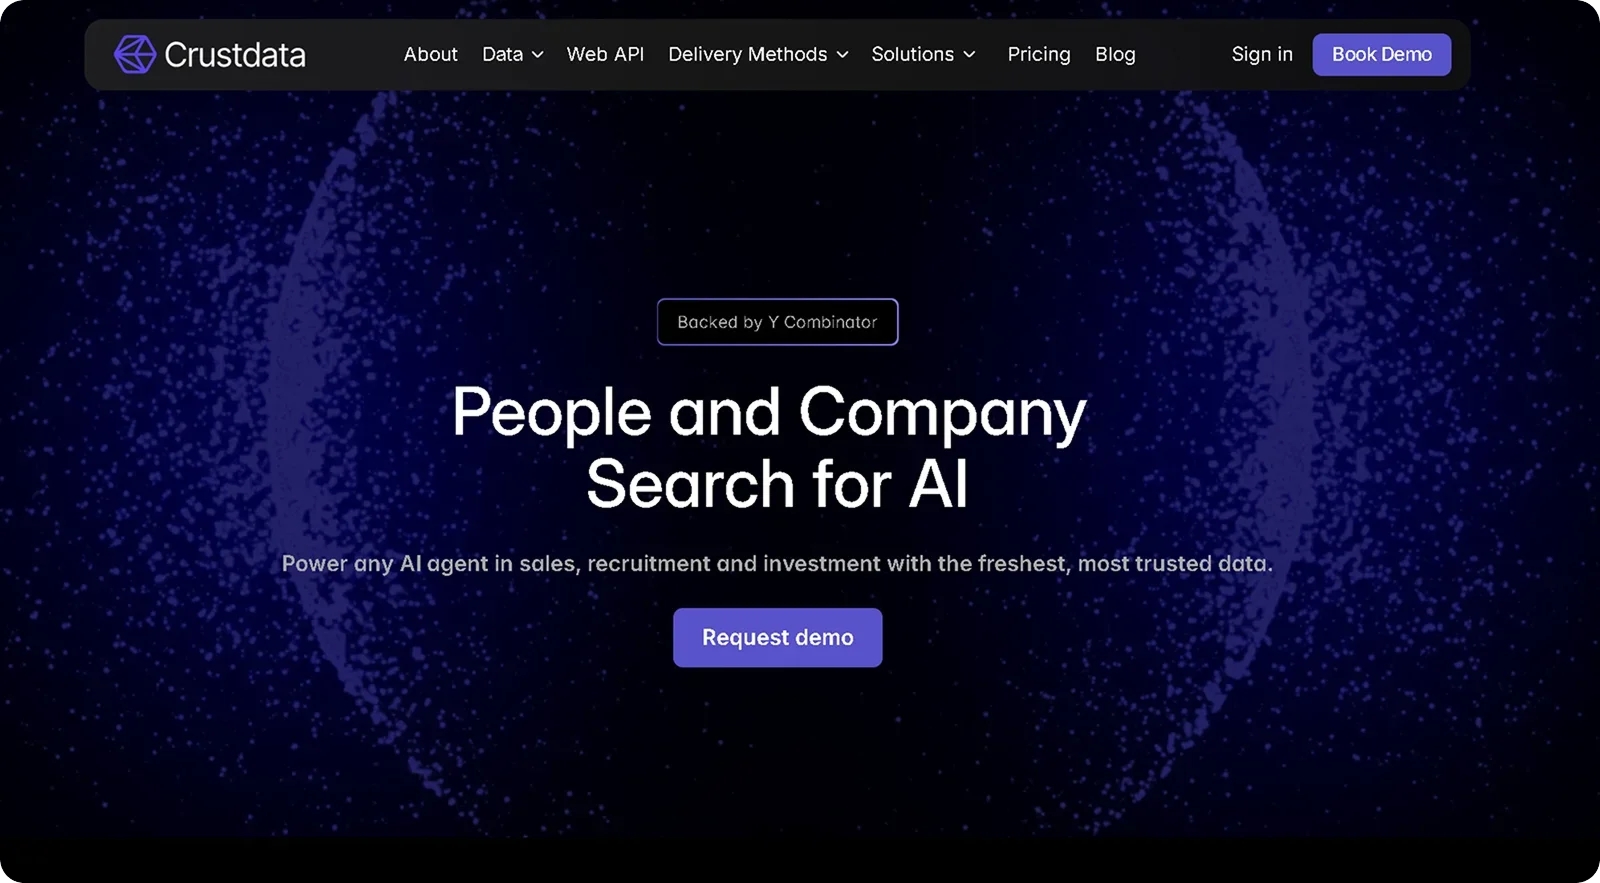
Maps 5M+ companies to their tech stack, detected from public web signals and job postings, with tool names normalized so variants resolve to a single technology.
Returns through the same API calls teams already use for firmographics (Company Enrich, Batch Enrich, Company Search, and Autocomplete), so a single enrich call can return both what a company is and part of what it runs.
Because detection leans on job postings and other sources across the web, it surfaces backend and internal tools that website crawlers do not expose, and it doubles as a hiring-intent signal. This is the method our buyers asked for by name, and returning it inside an existing call is the request we heard most after that.
API-first, priced as a usage-based add-on.
Best for teams building automated or API-driven workflows that want firmographic and technographic data in one call.
TheirStack
Reads millions of job postings and applies language processing to work out what technologies a company is hiring for and running, which surfaces backend and internal tools a website crawler cannot see.
Aggregates postings from more than 351,000 sources, including career pages, job boards, and applicant tracking systems, and reports coverage of over 32,000 technologies. Because the signal is a job posting, it doubles as a hiring-intent read.
Available through an API and CSV export, with both keyword and semantic search modes.
A free tier gives 200 credits a month. Paid plans start at $59/month, with one-time credit purchases also available.
Best for teams whose targeting depends on backend tooling and active hiring signals rather than the public web stack.
PredictLeads
Combines several company signals in one dataset, tracking job openings, funding events, news, and the technologies a company uses.
Technographics are pulled from script tags, DNS records, IP ranges, cookies, and mentions in job descriptions, spreading detection across both the visible and the hiring-driven stack. It reports more than 54,000 technologies across over 120 million companies, with about 86 million carrying technology data, and job openings refreshed roughly every 36 hours.
Built for engineering teams to consume, with delivery through a REST API, flat files, webhooks, and an endpoint for AI agents.
Pricing is not public and runs through a sales conversation. There is a free tier of 100 API requests a month for testing.
Best for product and data teams wiring hiring, funding, and technology signals directly into their own applications or CRM.
Coresignal
Delivers fresh, structured public web data across companies, employees, and job postings, including firmographic and technographic fields and technology mentions extracted from job listings.
Scale is on the raw data side, with more than 103 million company records, 792 million employee records, and 260 million job posting records. New job records are added every six hours and over 695 million records refresh each month.
Delivery is through Company, Employee, and Jobs APIs or bulk dataset files, which suits teams that want to build their own enrichment rather than work inside a sales UI.
APIs start at $49/month and full datasets start at $1,000, with tailored quotes above that.
Best for data and engineering teams that want raw, refreshable datasets or APIs to power their own products and models.
Sales-intelligence platforms with technographics
ZoomInfo
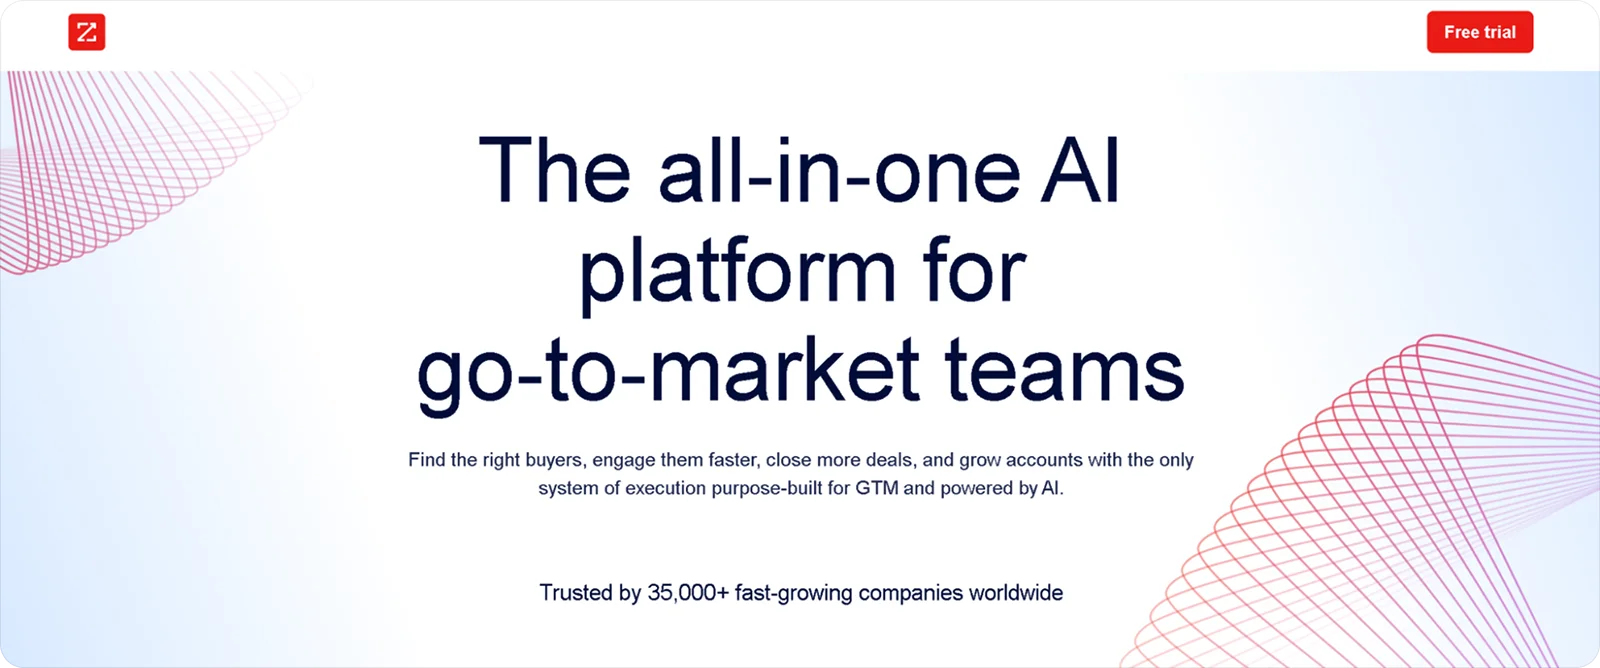
Folds technographics into a broad sales-intelligence platform, blending verified and licensed data with crawling across more than 20 source types, including company websites, job postings, and customer testimonials.
Reports more than 30,000 technologies across over 100 million companies and 200-plus categories, with roughly 90% of active tech-to-company pairings refreshed within the past three months.
The technographic layer sits alongside contact data, intent, and firmographics in one platform. Delivery runs through CRM and sales-engagement integrations plus an API, and the compliance posture includes SOC 2 Type II, ISO 27001 and 27701, and GDPR and CCPA handling.
Pricing is custom and annual, typically starting around $15,000 a year and climbing with seats, intent, and add-ons.
Best for larger go-to-market teams that want technographics as one layer inside a full contact and intent suite.
Cognism
A compliance-first B2B data platform known for phone-verified mobile numbers and strong European coverage, with technographics offered as a secondary layer.
Its technographic database covers roughly 20,000 technologies, though the depth is thinner than dedicated technology providers and the richer access sits on the higher tier.
Core strength is contact data built on a documented GDPR basis, with notifications and opt-out handling, backed by ISO 27001 and 27701 and SOC 2 Type II certifications. Data flows into CRM systems and through an API.
Pricing is custom, with platform fees that commonly start around $15,000 a year plus per-seat costs, and intent add-ons priced per topic.
Best for teams selling into Europe and the US that need compliant contact data first, with technographics as a supporting filter.
Apollo.io
An all-in-one prospecting platform where technographics show up as search filters inside a large sales database rather than as a standalone product.
The technographic filter finds companies running a given tool, a common competitive-displacement setup, and sits next to firmographic and intent filters. Because Apollo bundles data with outreach, the same query flows straight into sequences and CRM sync without a separate enrichment step.
Full API access is reserved for the top tier, while lower tiers focus on in-app prospecting.
There is a free plan. Paid plans start at roughly $49 per user per month for Basic, then about $79 for Professional and $119 for Organization.
Best for SMB and mid-market reps who want technographic filtering plus sequencing and CRM sync in one affordable tool.
Clearbit (now HubSpot Breeze Intelligence)
Now Breeze Intelligence, the name HubSpot gave the product after acquiring Clearbit in late 2023 and folding it into its Breeze AI suite.
Enriches company and contact records at the point of capture, adding firmographic detail plus some software and cloud signals, and runs natively inside HubSpot as well as through an API. Technographic depth is lighter than dedicated providers, since it is aimed at general enrichment rather than a full install-base catalog.
The model is credit-based, where one credit enriches one record, credits are sold in packs, and they reset every 30 days with no rollover.
Requires a paid HubSpot subscription. Breeze Intelligence credits start around $45/month for 100 credits on annual billing on top of the HubSpot plan.
Best for HubSpot customers who want automatic enrichment on records inside the CRM rather than a separate technographic tool.
Intent and ABM platforms
Bombora
Runs a consent-based data cooperative where more than 5,000 B2B publisher sites share anonymized content-consumption signals, and its Company Surge product flags when a company researches a topic more than usual.
Tracks over 13,000 topic categories, including technology research topics, across roughly 17 billion interactions a month, and reports surges weekly. This is intent data rather than a technology install catalog, so it tells you what an account is reading about rather than confirming what software it runs.
Signals flow into CRM, ABM, and advertising systems through integrations and an API, and Bombora also supplies intent to other platforms such as Cognism and Demandbase.
Pricing is custom and commonly starts around $30,000 a year, rising with topics and audience scope.
Best for teams that want weekly, topic-level buying intent, including technology research, to prioritize accounts in an ABM motion.
6sense
An enterprise ABM platform that combines intent, firmographic, and technographic data to predict which accounts are in-market and where they sit in the buying cycle.
Its detection engine ingests a very large volume of daily signals, and the database reports 415 million profiles, more than 65 million companies, and over 30,000 technographics. Technographics feed the account model as one input among many, so the platform is more about scoring and prioritization than serving a raw technology list.
Scoring runs continuously and pushes into CRM and ABM workflows through integrations and an API.
Pricing is enterprise and custom, with third-party data putting typical annual spend in the range of $55,000 to $130,000 and higher for full predictive and data-credit bundles.
Best for enterprise ABM teams that want predictive buying-stage scoring with technographics as one signal in the model.
Demandbase
An enterprise ABM and account-intelligence platform that blends firmographic, technographic, and intent data, drawing intent in part from partners such as Bombora.
Its own product page states more than 47,000 technologies across over 136 million domains, and it claims to reach some software behind the firewall that pure crawlers miss. The technographic catalog is one layer inside a wider account-intelligence stack that also carries advertising, orchestration, and engagement history.
Delivery runs through CRM and ABM integrations plus an API, so technographic segments can drive both targeting and advertising.
Pricing is custom, with account-intelligence entry commonly starting around $24,000 a year, a median near $65,000, and full ABM deployments running into six figures.
Best for ABM teams that want a broad technographic catalog fused with intent inside a single account-intelligence platform.
Enterprise IT-spend intelligence
HG Insights
Focuses on technology intelligence at the enterprise level, going beyond which tools a company runs to estimate how much it spends and when its contracts renew.
Profiles more than 12 million global organizations, tracks around 32,000 IT software and service contracts, and forecasts IT spend across more than 120 sub-segments at global, regional, and country levels. Blending licensed sources with its own research is what allows the spend and contract-value estimates that most crawlers cannot produce.
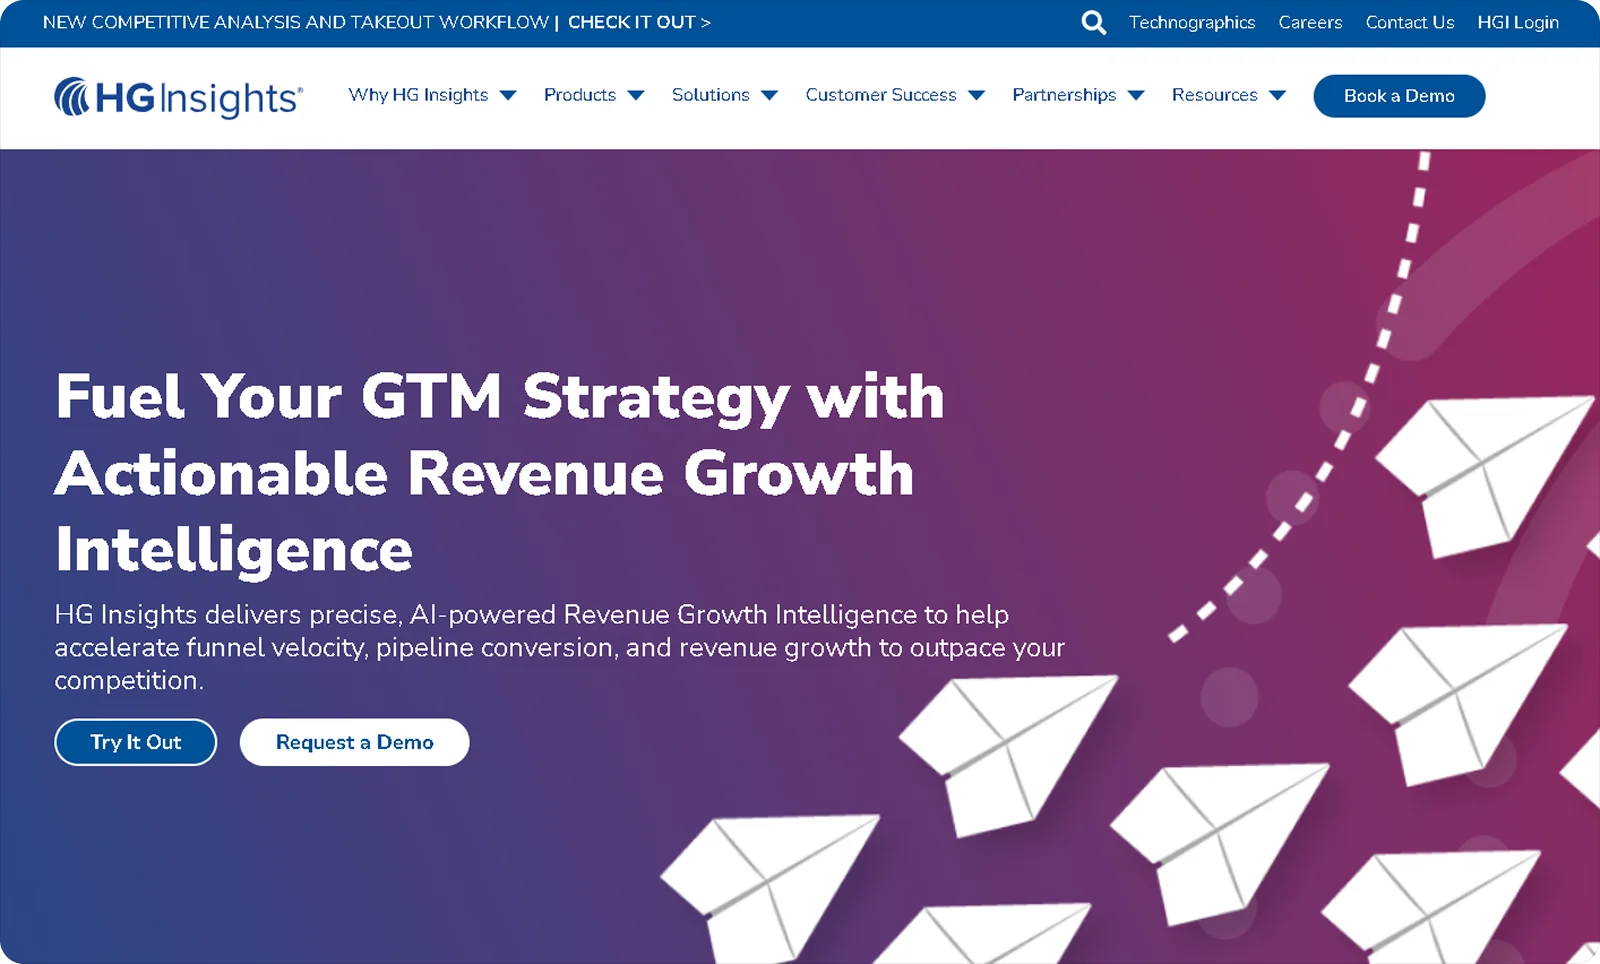
Its Revenue Growth Intelligence platform brings technographics, intent, IT spend, and contact data together, with delivery through the platform, an API, and CRM connectors.
Pricing is custom, typically ranging from about $12,000 to $90,000 a year with a median near $55,000, and the standard contract term is two years.
Best for enterprise teams doing account planning and territory sizing that need IT spend and contract-renewal timing, not just a list of installed tools.
How to Choose a Technographic Data Provider
There is no single best provider, only the best fit for the technologies you sell around and the way you work. Weigh these criteria.
Detection method fit. Start here. If your product attaches to website technology (analytics, tag managers, CMS, ecommerce), a web-crawl source like BuiltWith or Wappalyzer will serve you well. If it attaches to backend or internal tools (databases, data warehouses, internal CRMs, engineering platforms), you need job-posting and public-signal detection (TheirStack, PredictLeads, Crustdata) because crawlers cannot see those. If you need confirmed installs plus contacts, a blended platform fits.
Coverage of the tools you care about. A large headline technology count matters less than whether the provider tracks the specific tools your targeting depends on. Test a provider against a sample of accounts where you already know the stack.
Freshness. Ask how often the data refreshes and whether the provider timestamps detections. Intent data moves weekly, install data changes more slowly, and job-posting signals track posting cadence. Match the refresh rate to how time-sensitive your play is.
Accuracy and confidence. Any inferred data point is an estimate. Look for confidence indicators or verification, and validate against accounts you can ground-truth before you trust a list at scale.
Delivery and API. Decide whether you need a UI, CSV exports, native CRM enrichment, or a raw API. Automated and agent-driven workflows need clean API access and normalized tool names so values resolve consistently. A tool with great data behind an export-only UI may not fit a programmatic pipeline. This came up constantly in our own conversations, where teams wanted to stop stitching a separate technographic vendor into the pipeline and instead get the data back in a call they already make.
Pricing model. Compare starting price and, more importantly, the cost model, whether that is per-seat, per-record, credit-based, or an enterprise contract. Usage-based and credit-based pricing (for example a per-enrich add-on) is easier to start small with than an annual platform commitment.
Compliance. For regulated or international outbound, check the provider's GDPR, CCPA, and SOC 2 posture. Enterprise platforms like ZoomInfo and Cognism lean on documented compliance, which can matter as much as coverage.
What You Can Do With Technographic Data
A few common plays, so the criteria above connect to real work. These are ordered by what buyers actually asked us to do with the data, not by what reads best in a guide.
Competitive displacement. This is the play we heard most. Identify companies using a competitor's tool and prioritize them for switch-focused messaging, for example targeting accounts running one platform but not the one you replace. Job-posting signals can surface a migration before it shows up anywhere public. One team selling into enterprise consulting told us their clients care most about a single question, whether a target is in the middle of an SAP or Salesforce transformation, because that window is when the deal is winnable.
Account targeting and list-building by tooling. Filter your total addressable market to companies that run (or lack) a specific technology, so reps spend time on accounts where your product has a clear reason to exist. Building a list of every company running a given tool was, in our tracker, the single most-requested use case, ahead of any other.
Timing and triggers. Hiring for a tool, funding, or a new technology signal can mark the moment an account becomes reachable. Buyers repeatedly asked to be alerted when a target's stack changes rather than pulling a static list, so they can act on the add or the drop. Signal-led providers and change-monitoring tools (PredictLeads, and Crustdata's Watcher) are built for this.
Segmentation and personalization. Group accounts by stack to tailor messaging, so a company running Snowflake hears a different pitch than one running BigQuery.
Where Crustdata Fits
Crustdata is a technographic data provider in the job-posting and public-web-signal detection class, alongside tools like TheirStack, PredictLeads, and Coresignal, rather than a website-crawl catalog like BuiltWith. That placement is deliberate, and it shapes what the data is good at.
It is also the class our own customers pointed us toward. When 133 teams asked us for technographic data, the shape of the request was consistent. They wanted us to infer the stack from job postings, return it in a call they already make, and watch for changes over time. The feature is built around those three asks.
Here is what the feature does today. It maps 5M+ companies to their tech stack, detected from public web signals and job postings, with tool names normalized so variants resolve to one technology. Because it reads job postings and public signals rather than only website code, it surfaces backend and internal tools that crawlers do not expose. The data is returned through the same API calls teams already use for firmographics (Company Enrich, Batch Enrich, Company Search, and Autocomplete), so one enrich call can carry both firmographic and technographic fields. Tech-stack change can also be monitored as a trigger through Crustdata's Watcher, for teams that want to act on a migration rather than pull a static list.
The real advantage here is not the size of the technology catalog. A dedicated crawler like BuiltWith will always list more front-end technologies. The advantage is two concrete things. First, the data comes back inside an API call you are already making for firmographics, so there is no second vendor to stitch in. Second, because it reads job postings, it picks up the backend and internal tools that website crawlers never see. Crustdata is API-first and returns normalized tool names, which suits automated and agent-driven workflows. If you need the deepest website-technology catalog, a dedicated crawler will have more front-end breadth. If you want firmographic and technographic data together, delivered by API, with backend-tool signals from job postings and the option to trigger on a stack change, Crustdata is a strong fit.
Frequently Asked Questions
What is technographic data?
Technographic data is information about the technologies a company uses, from its website stack and business software to its cloud infrastructure. Teams use it to find accounts that run (or are adopting) tools that make their product relevant, and to time outreach.
What is the difference between technographic and firmographic data?
Firmographic data describes what a company is (industry, size, revenue, location). Technographic data describes what it runs (its software and infrastructure). Most targeting uses both, firmographics for the shape of the account and technographics for fit and timing.
How is technographic data collected?
There are mainly four ways, crawling company websites for front-end code, inferring the stack from job postings and public signals, gathering self-reported or contributor-network data, and blending licensed third-party sources. Web crawling sees the front end, while job-posting inference catches backend and internal tools crawlers miss.
Should technographic data come from web crawling or job postings?
It depends on which part of the stack you sell around, and the two methods are not interchangeable. Web crawling is best for website-facing technology, analytics, tag managers, chat, CMS, ecommerce, because those leave a public fingerprint. Job-posting inference is best for the backend and internal stack, databases, data warehouses, internal platforms, because those rarely show up on a homepage but do show up in who a company is hiring. In our own customer conversations, when teams described the tech stack data they wanted, most asked for the job-posting version, since the systems they were selling around were the ones a crawler could not see. A crawl-only tool often reads as sparse on exactly those systems. If you can, use both, crawl for the front end and job postings for the rest.
How often should technographic data refresh?
It depends on the signal. Intent data moves weekly, website-install data changes more slowly, and job-posting signals track how often a company posts roles. Ask each provider how it timestamps and refreshes detections, and match that to how time-sensitive your play is. If you are timing a displacement, consider a source that can alert you on a change rather than one you re-pull by hand.
How accurate is technographic data?
Directly detected data (a script found on a live website, a tool named in a job posting) is reliable. Inferred and modeled data is an estimate and should carry a confidence indicator. Validate any provider against a sample of accounts where you already know the stack before trusting it at scale.
Which technographic data provider is best for ABM?
Intent and ABM platforms such as 6sense, Demandbase, and Bombora are built for account-based marketing because they combine technographic signals with intent and orchestration. For pure install or backend-tool targeting to feed an ABM list, a detection specialist can complement them.
How much does technographic data cost?
Models vary widely. Entry tools start around $29 to $295 per month, usage- and credit-based options (for example a per-enrich add-on) let you start small, and enterprise platforms are custom-quoted on annual contracts. Match the pricing model to your volume and how programmatic your usage is.
Can I get firmographic and technographic data in one place?
Yes, and it is one of the most common asks we hear. Some providers return both in a single company record. Crustdata, for example, delivers technographic fields inside the same Company Enrich and Company Search API calls that return firmographic data, so you do not have to join two sources.


Products
Popular Use Cases
Competitor Comparisons
95 Third Street, 2nd Floor, San Francisco,
California 94103, United States of America
© 2026 Crustdata Inc.
Products
Popular Use Cases
Competitor Comparisons
95 Third Street, 2nd Floor, San Francisco,
California 94103, United States of America
© 2026 CrustData Inc.
Products
Popular Use Cases
Competitor Comparisons
95 Third Street, 2nd Floor, San Francisco,
California 94103, United States of America
© 2026 Crustdata Inc.
🎉 We hit $10M ARR!
$600k to $10m in 1.5 years. Our entire GTM is powered by our own APIs.
🎉 We hit $10M ARR in 1.5 years!