How to Use Firmographic and Technographic Data Combined [Guide]
Learn how to use firmographic and technographic data combined to target better accounts and focus on prospects with real potential to convert.
Published
Written by
Chris P.
Reviewed by
Nithish A.
Read time
7
minutes

Most B2B teams use firmographic and technographic data separately. They filter by industry and headcount to define who to target, then check tech stack data as a secondary step. The teams that want to reduce wasted outreach tend to use both together. Fewer unqualified accounts enter the pipeline, which means reps spend more time on conversations that have a realistic path to close.
This guide covers what each data type covers, why combining them outperforms using either alone, and how to implement combined queries in practice.
Key Takeaways
Firmographic data identifies which companies fit your ICP based on size, industry, revenue, and funding stage. Technographic data identifies how those companies operate based on the tools and infrastructure they use. Neither data type answers both questions on its own.
Combining both in a single query eliminates two failure modes at once: broad lists with no relevance context, and tech-filtered lists with no scale or budget signal.
The three highest-value use cases for combined targeting are integration-based prospecting, competitive displacement, and tech stack qualification before discovery calls.
Technographic signals from web crawling and job posting analysis are strong indicators of tool usage, not confirmed installations. Use them to prioritize accounts, not to disqualify them.
What Is Firmographic Data?
Firmographic data describes a company. It is the B2B equivalent of demographic data for individuals, providing the structural attributes that determine whether an account belongs in your pipeline before you look at a single contact name.
The core firmographic fields include:
Industry and vertical: Standard classifications like SIC or NAICS codes, or custom labels like "B2B SaaS" or "fintech"
Company size: Employee headcount as a range or precise count
Revenue: Estimated annual revenue, typically derived from third-party enrichment sources
Geography: Headquarters location and largest employee concentration by country
Funding status: Total investment raised, funding stage, and most recent round date
Company type: Public, private, nonprofit, or government entity
Firmographic data answers one question well: Does this company fit our ICP? It does not tell you how they operate, what tools they rely on, or whether your product is compatible with their existing environment.
What Is Technographic Data?
Technographic data data describes how a company operates. It maps the software, infrastructure, and digital tools an organization has adopted across its technology stack.
This can include customer-facing technologies such as chatbots, automated outreach platforms, or an AI voice agent, all of which help reveal how a business engages prospects and scales communication.
Common technographic categories include:
CRM and sales tools: Salesforce, HubSpot, Microsoft Dynamics
Marketing automation: Marketo, Pardot, ActiveCampaign
Cloud infrastructure: AWS, Azure, Google Cloud Platform
Analytics and tracking: Google Analytics, Mixpanel, Amplitude
Development frameworks: JavaScript libraries, CMS platforms, ecommerce carts
Technographic data is collected primarily through two methods. Website crawling detects frontend technologies from HTML, page headers, and JavaScript tags. Job posting analysis surfaces tools mentioned in hiring requirements, which reliably indicate active internal usage.
Detection accuracy is strongest for frontend and publicly visible technologies and weaker for backend infrastructure that leaves no visible trace.
Technographic data answers a different question from firmographic: Does this company already use technology that makes your product relevant, compatible, or immediately applicable?
Why Combining Firmographic and Technographic Data Outperforms Either Alone
Firmographic data alone produces broad lists. A filter for "B2B SaaS companies with 100 to 500 employees" returns thousands of accounts, many of which have no compatibility with your product, no relevant infrastructure, and no buying context that makes your pitch land.
Technographic data alone produces lists with no scale context. Knowing that a company uses Salesforce says nothing about whether it has 10 employees and one sales rep or 500 employees and a full revenue operations function. Both show up in the same technographic filter.
Combined, the two data types eliminate both problems at once. They let you target companies that fit your ICP and already operate in a way that makes your product relevant right now. Here are three use cases where this matters most.
Integration-based targeting. If your product integrates with Salesforce, filtering for companies that run Salesforce and have 50 to 500 employees in SaaS gives you a list of prospects who can use what you sell without a migration project. The conversation starts with compatibility, not with educating them about a new ecosystem.
Competitive displacement. If you know which companies use a competitor's product, layer firmographic filters to find the subset that matches your ICP. You are reaching companies that already understand the category and have budget allocated to it, which removes the education phase of the sales cycle. The tradeoff is that switching costs and existing contracts can extend the decision timeline, so displacement plays tend to work best when paired with a trigger event like a renewal window or a recent executive hire.
Tech stack qualification. Some products only work within specific infrastructure environments.If your product requires AWS, filtering for companies with AWS signals before prospecting removes the majority of accounts that would fail a technical qualification call. The remaining list still needs verification, but your team starts from a shorter, higher-probability lead list rather than discovering poor fits halfway through a sales cycle.
How to Run a Combined Firmographic and Technographic Query in Practice
The most reliable way to execute combined queries at scale is through an API that returns both firmographic and technographic signals in the same request. Crustdata's Company Search API supports multi-filter queries combining firmographic criteria like headcount, industry, funding stage, and geography with growth and technographic signals in a single call.
Here is a practical example. The goal is to find B2B SaaS companies in North America with 50 to 500 employees that have raised funding in the past 12 months, then add a technographic layer indicating active use of Salesforce or HubSpot.
Step 1: Define your criteria in plain language
Before writing a single line of code, write out exactly what you are looking for in plain language. This step prevents over-engineering your filters from the start and makes it easier to adjust criteria when results are too broad or too narrow.
A combined firmographic and technographic query should answer two questions at once: who is the company, and how do they operate? Map one set of criteria to each before translating them into API filters.
For this example, the target profile looks like this:
Industry: Technology or Information Technology and Services
Headcount: 51 to 500 employees, indicating a company past the early startup stage with enough budget and team structure to be a realistic buyer
Geography: United States or Canada
Recent funding signal: A funding event in the past 12 months, indicating active growth and available budget
Technographic signal: Active use of Salesforce or HubSpot, indicated by mentions in job postings or company descriptions
The last two criteria are what separate this from a standard firmographic query. The funding filter surfaces companies in an active investment cycle, and the technographic filter confirms they already operate with a CRM in place, removing the need to sell them on adopting one alongside your product.
Step 2: Translate into an API request
A well-structured company search API takes a POST request with a JSON body containing your filter criteria. Filters apply logical AND by default, meaning every condition must be met for a company to appear in results. The example below uses Crustdata's Company Search API to demonstrate how a multi-condition query looks in practice.
json POST https://api.crustdata.com/screener/company/search Authorization: Bearer <your_token> Content-Type: application/json { "filters": [ { "filter_type": "INDUSTRY", "type": "in", "value": ["Technology", "Information Technology and Services"] }, { "filter_type": "COMPANY_HEADCOUNT", "type": "in", "value": ["51-200", "201-500"] }, { "filter_type": "REGION", "type": "in", "value": ["United States", "Canada"] }, { "filter_type": "ACCOUNT_ACTIVITIES", "type": "in", "value": ["Funding events in past 12 months"] }, { "filter_type": "KEYWORD", "type": "in", "value": ["Salesforce", "HubSpot"] } ], "page": 1 }
json POST https://api.crustdata.com/screener/company/search Authorization: Bearer <your_token> Content-Type: application/json { "filters": [ { "filter_type": "INDUSTRY", "type": "in", "value": ["Technology", "Information Technology and Services"] }, { "filter_type": "COMPANY_HEADCOUNT", "type": "in", "value": ["51-200", "201-500"] }, { "filter_type": "REGION", "type": "in", "value": ["United States", "Canada"] }, { "filter_type": "ACCOUNT_ACTIVITIES", "type": "in", "value": ["Funding events in past 12 months"] }, { "filter_type": "KEYWORD", "type": "in", "value": ["Salesforce", "HubSpot"] } ], "page": 1 }
json POST https://api.crustdata.com/screener/company/search Authorization: Bearer <your_token> Content-Type: application/json { "filters": [ { "filter_type": "INDUSTRY", "type": "in", "value": ["Technology", "Information Technology and Services"] }, { "filter_type": "COMPANY_HEADCOUNT", "type": "in", "value": ["51-200", "201-500"] }, { "filter_type": "REGION", "type": "in", "value": ["United States", "Canada"] }, { "filter_type": "ACCOUNT_ACTIVITIES", "type": "in", "value": ["Funding events in past 12 months"] }, { "filter_type": "KEYWORD", "type": "in", "value": ["Salesforce", "HubSpot"] } ], "page": 1 }
The KEYWORD filter surfaces companies where Salesforce or HubSpot appears in job postings, profile descriptions, or company specialties. This is a reliable signal that these tools are actively in use, rather than merely having been evaluated or mentioned in passing.
Each result returns a structured JSON profile including employee count, revenue range, headquarters, funding details, headcount growth percentages across six-month, one-year, and two-year windows, and company specialties. This data can pipe directly into a CRM or downstream enrichment workflow without manual processing.
Step 3: Set up alerts for ongoing monitoring
Static list building captures a moment in time. A company that does not meet your headcount filter today may cross the threshold next month after a hiring push following a funding round. Without ongoing monitoring, that account never makes it into your pipeline.
For example, Crustdata's Watcher API lets you monitor a filtered account set for events that change the targeting picture. When a company in your saved filter crosses a threshold, a webhook fires immediately rather than waiting for your next scheduled data pull.
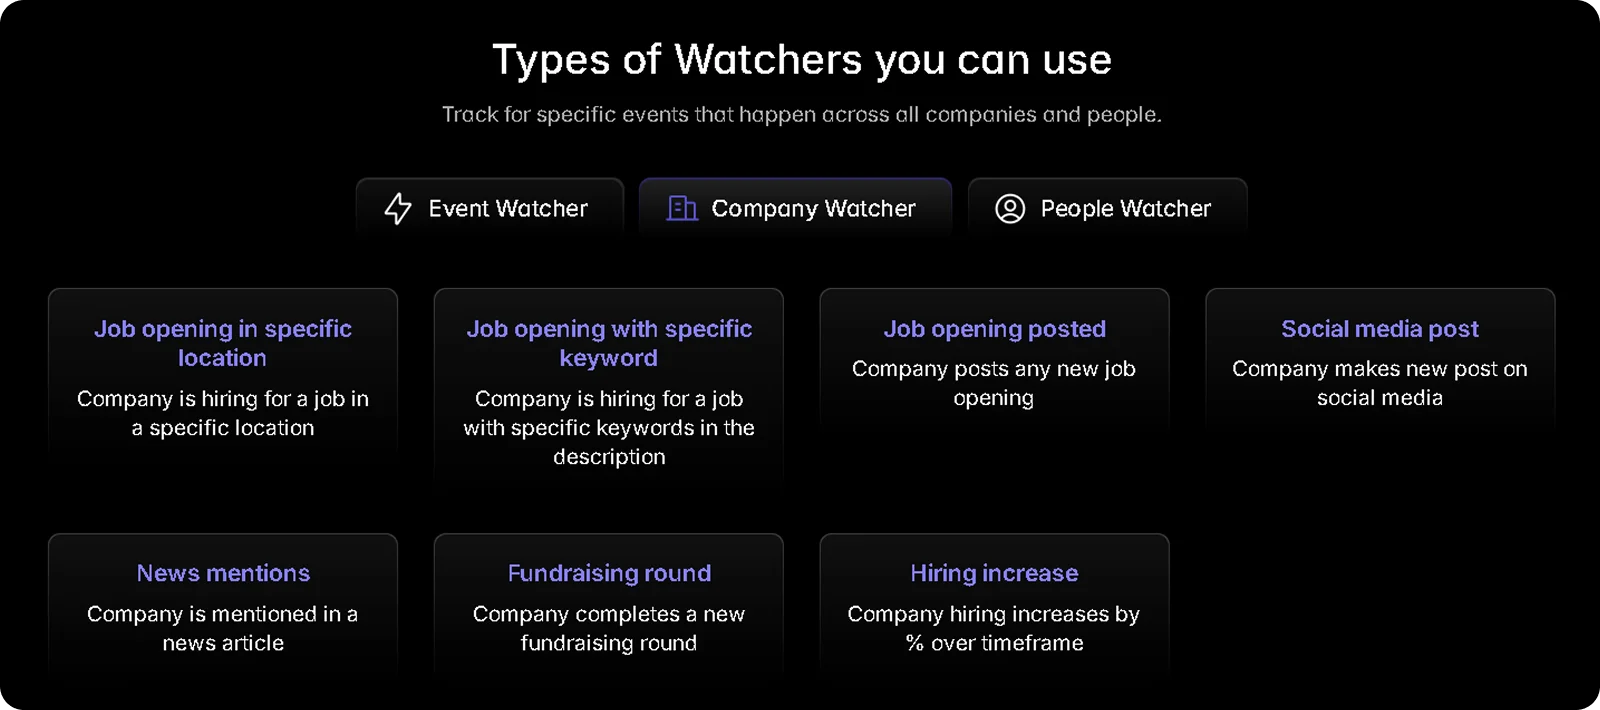
Events that trigger a Watcher alert include:
New funding rounds: A company raises a Series A or B, signaling budget availability and active growth
Headcount growth spikes: Employee count crosses your minimum threshold or grows faster than a defined percentage
Executive hires: A new VP of Sales, CTO, or Head of Revenue joins, often indicating a shift in buying priorities
Technology adoption signals: New tools appear in job postings or company descriptions, confirming a relevant stack change
Setting up a Watcher converts a one-time list into a live pipeline. Rather than re-running the same query manually every few weeks, accounts enter and exit your target set automatically as their firmographic and technographic profiles evolve.
This is particularly useful for competitive displacement plays. If you are targeting companies using a competitor's product, a Watcher alert fires the moment a relevant signal suggests the account is re-evaluating its stack, giving your team a reason to reach out before the decision is already made.
Common Mistakes When Combining These Data Types
Below are some mistakes to avoid when combining firmographic and technographic data:
Over-filtering on the first pass: Running a heavily stacked query from the start often returns too few results to be actionable. Start with your firmographic foundation, typically three to five core criteria like industry, headcount, and geography. Review the output, then layer in technographic and activity filters once you understand the population size you are working with.
Treating technographic signals as confirmed facts: A company that lists Salesforce repeatedly in job postings is almost certainly a Salesforce user. A company that does not appear may still use it. Technographic signals derived from web crawling and job posts are strong indicators, not verified installations. Use them to prioritize accounts, not to make final qualification decisions.
Ignoring data freshness: Firmographic and technographic data both decay as companies hire, restructure, and switch tools. A list built three months ago needs to be re-run before a campaign goes out. Tools that pull live data at the point of query return current signals rather than cached data that may already be outdated by the time you act on it.
Building lists without a clear action attached: The output of a combined query is only as valuable as what your team does with it. Define the outreach motion before building the list, including what the first message says, what qualifies an account for a follow-up call, and how it gets routed in your CRM.
How Crustdata Supports Combined Firmographic and Technographic Queries
Crustdata pulls data from 10+ verified sources at the moment of each request, so the firmographic and technographic signals returned reflect where a company actually is at the time of the query, not where it was when a database last ran.
For each company in your results, a single API call returns:
Firmographic data: industry, headcount, revenue range, headquarters, and company type
Headcount growth percentages across six-month, one-year, and two-year windows
Funding signals: total investment raised, funding stage, and most recent round date
Web traffic trends and employee skill distribution
Technographic signals from job postings and company descriptions
For teams building automated prospecting pipelines or AI sales agents, live data matters because every downstream action depends on the accuracy of the account profile feeding it. A company that raised a Series A three months ago and grew from 40 to 90 employees appears with its current headcount.
The Watcher API adds a continuous monitoring layer on top of search. Rather than waiting for a scheduled data pull, it fires a webhook the moment a relevant signal occurs, such as a new funding round, a headcount spike, an executive hire, or a change in technology adoption.
For B2B data challenges that stem from acting on stale signals, event-triggered alerts significantly narrow the gap between when a signal becomes visible and when your team can act on it.
Ready to run combined queries against your ICP?
Book a demo to see Crustdata's Company Search and Watcher APIs in action.
FAQs
What is the difference between firmographic and technographic data?
Firmographic data describes what a company is: its industry, size, revenue, location, and funding stage. Technographic data describes how a company operates: the software tools, platforms, and infrastructure it uses. Combined, they answer both whether a company fits your ICP and whether your product is compatible with their existing environment.
How accurate is technographic data?
Accuracy depends on how the data is collected. Web crawling is reliable for frontend technologies like analytics tools, CMS platforms, and tracking scripts, with an accuracy of around 80 to 90% for commonly used tools.
Backend and server-side technologies are harder to detect. Job posting analysis adds a useful complementary signal but reflects stated tool usage rather than confirmed installations. Use technographic data to prioritize accounts, not to make final qualification decisions.
How often should combined firmographic and technographic lists be refreshed?
B2B company data decays as organizations hire, restructure, and change their tech stack. For active outbound campaigns, refreshing the account list every four to six weeks is a reasonable starting point. The right cadence depends on how fast your target segment moves. Early-stage companies in high-growth sectors change headcount and tooling faster than established mid-market accounts, so adjust based on how quickly your lists decay in practice.
For automated pipelines and AI agent workflows, live data queries at the point of execution are preferable to periodic refreshes. This is because any lag between data collection and action can result in reaching a contact at a role or company that no longer fits the target profile.


Products
Popular Use Cases
Competitor Comparisons
Use Cases
95 Third Street, 2nd Floor, San Francisco,
California 94103, United States of America
© 2026 Crustdata Inc.
Products
Popular Use Cases
Competitor Comparisons
Use Cases
95 Third Street, 2nd Floor, San Francisco,
California 94103, United States of America
© 2025 CrustData Inc.
Products
Popular Use Cases
Competitor Comparisons
Use Cases
95 Third Street, 2nd Floor, San Francisco,
California 94103, United States of America
© 2026 Crustdata Inc.