How to Overcome Firmographic Data Accuracy Challenges? [Guide]
Learn how to overcome firmographic data accuracy challenges and improve targeting with cleaner, up-to-date company data for better decisions.
Published
Written by
Chris P.
Reviewed by
Nithish A.
Read time
7
minutes

Firmographic data accuracy challenges affect every B2B team that relies on company attributes like industry, headcount, revenue, and funding stage to define and prioritize their ICP. The problem is not access. Most teams have firmographic data. The problem is that the data they are working from is often wrong, incomplete, or outdated before anyone acts on it.
This guide breaks down the specific accuracy challenges in firmographic data that arise in practice, why they happen, and how to fix them without rebuilding your data stack from scratch.
Key Takeaways
B2B company records are not static. A study tracking 1,000 business contacts found that 70.8% experienced at least one change within 12 months, making annual enrichment actively harmful to pipeline quality
Revenue estimates for private companies vary between providers for the same account
Quarterly re-enrichment is the minimum viable refresh cadence for active pipeline databases
Combining first-party CRM signals with third-party enrichment consistently produces more accurate firmographic profiles than either source alone
Why Firmographic Data Accuracy Is Harder Than It Looks
Firmographic data tends to be more stable than contact data. This is because a company's industry does not change the way an email address does. But the fields that sales and marketing teams rely on most shift constantly as companies hire, restructure, raise capital, and change direction.
For teams running automated prospecting workflows or AI sales agents, inaccurate firmographic data does not just produce bad lists. It corrupts every downstream action that depends on those records.
According to a 2025 IBM Institute for Business Value report, over a quarter of organizations estimate they lose more than $5 million annually due to poor data quality. For B2B teams, that cost shows up across wasted ad spend, missed pipeline targets, and revenue lost to poor segmentation and targeting decisions.
Firmographic Data Accuracy Challenges Teams Face
Not all firmographic attributes carry the same risk when wrong. The table below shows which fields are most prone to inaccuracy and what happens downstream when they are off.
Field | Accuracy risk | Primary cause | Downstream impact |
Private company revenue | High | Estimated, not reported | Wrong lead scoring, poor territory planning |
Total headcount | Medium | No department breakdown | Poor-fit accounts pass ICP filters |
Industry classification | Medium | Broad codes, outdated taxonomy | Oversized, low-quality prospect lists |
Funding stage | High | Point-in-time data changes frequently | Misaligned messaging and deal size expectations |
Headquarters location | Low | Rarely changes | Minimal unless territory-based targeting |
Headcount growth rate | Medium | Lag between actual growth and database update | Missed accounts in active growth phase |
Revenue Estimates For Private Companies are Unreliable
Private companies do not publicly report revenue. Firmographic data providers estimate it using employee count, industry benchmarks, funding history, and web traffic. The same company can show revenue estimates that vary between providers.
When your lead scoring model or territory plan depends on a revenue threshold, that kind of gap sends the wrong accounts to the wrong reps. Treat private company revenue as a rough guide rather than a hard qualification filter. Cross-reference estimates from at least two sources before making a decision based on revenue alone.
Total Headcount Hides the Real Picture
A 400-person company with 300 engineers and 50 in sales looks nothing like a 400-person company with 250 in customer success and 20 engineers. The headcount number is the same, but the buying context, budget authority, and product fit are completely different.
Filtering on total employee count alone is one of the most common sources of poor-fit leads in outbound pipelines. Where possible, supplement the total headcount with:
Department-level breakdown from job posting data
Headcount growth rate over six-month and twelve-month windows
Hiring velocity for functions that are relevant to your ICP
Industry Classification Codes are too Broad
Standard codes such as the North American Industry Classification System (NAICS) and the Standard Industrial Classification (SIC) were not designed for how B2B companies operate today. NAICS code 5112 covers everything from enterprise infrastructure vendors to niche productivity tools. Filtering on it returns thousands of accounts with almost nothing in common.
Sub-industry targeting is where real precision lives. "B2B SaaS companies selling into financial services" is a segment. "Software Publishers" is a haystack. Teams that rely on top-level codes without further segmentation consistently report low ICP match rates and high disqualification rates further down the funnel.
Data Goes Stale Between Enrichment Cycles
Given that nearly three-quarters of business records change each year, annual enrichment cycles leave your database well out of date before the next refresh even runs. For fast-growing sectors like technology and fintech, the problem is worse because companies hire, restructure, and raise capital more often.
A practical refresh cadence by pipeline stage:
Pipeline stage | Recommended refresh cadence |
Top of funnel, cold accounts | Quarterly |
Active outreach sequences | Monthly |
Accounts in open opportunities | At each touchpoint |
Automated AI agent workflows | Point-of-execution enrichment |
Single-source Enrichment Creates Blind Spots
No single data provider covers the entire B2B market. Single-source enrichment typically leaves some qualified prospects unreachable because the provider simply lacks a record for those accounts. Teams relying on a single vendor are targeting a subset of their ICP without realizing it.
Multi-source enrichment, where the system queries several providers in sequence until a verified record is found, consistently delivers better coverage and accuracy. Waterfall enrichment tools handle this sequencing automatically, removing the need for manual work.
How to Build a More Accurate Firmographic Data Foundation
These steps address the challenges above in a practical sequence, starting with the fixes that make the biggest difference fastest.
1. Audit your Database Before Enriching It
Re-enriching a database full of duplicates, mismatched domains, and wrong company types wastes credits and produces a cleaner version of the same inaccurate data. Before running enrichment:
Deduplicate records on the company domain and name
Standardize company name and website URL fields across all records
Flag records with missing key attributes like industry, headcount, and funding stage
Remove or merge subsidiary records incorrectly listed as separate companies
This audit tells you where your accuracy gaps are largest, which helps you decide which fields to fix first.
2. Use Growth Signals Alongside Static Attributes
Headcount growth rate, hiring velocity, and funding recency are more current and more useful for predicting buying behavior than static attributes like total employee count or estimated revenue. Layer these signals into your ICP definition alongside standard firmographic filters.
Key growth signals worth tracking:
Headcount growth percentage over six and twelve months
Number of open roles in ICP-relevant departments
Funding events in the past twelve months
Web traffic growth trends
Executive hires in relevant functions
3. Cross-reference Revenue Estimates Across Providers
For private company revenue, pull estimates from at least two sources before using revenue as a qualification filter. Where estimates differ significantly, treat the account as unknown on that attribute rather than relying on a figure that could be off by a large margin.
First-party signals like job posting volume, recent funding amount, and web traffic give you a more accurate overall view of company scale than any single revenue estimate from a provider.
4. Enrich at the Point of Action, Not on a Fixed Schedule
Scheduled quarterly enrichment is better than annual enrichment, but it still creates a gap between data collection and use. For accounts in active outreach sequences or AI-driven workflows, enriching the record when it enters the workflow ensures that the attributes driving qualification decisions reflect current reality.
Crustdata's firmographic data API and enrichment endpoints pull from 15+ sources at the moment of each request, returning current headcount, funding stage, revenue range, and growth signals. If you’re dealing with broader B2B data challenges arising from automated pipelines, point-of-execution enrichment removes the risk of staleness entirely.
5. Set Up Real-Time Monitoring For Key Account Changes
Even accurate firmographic data can be incorrect when a relevant event occurs at a target account. A company that closes a new funding round, crosses a headcount threshold, or brings in a new VP of Sales changes its profile in ways that affect its placement in your pipeline.
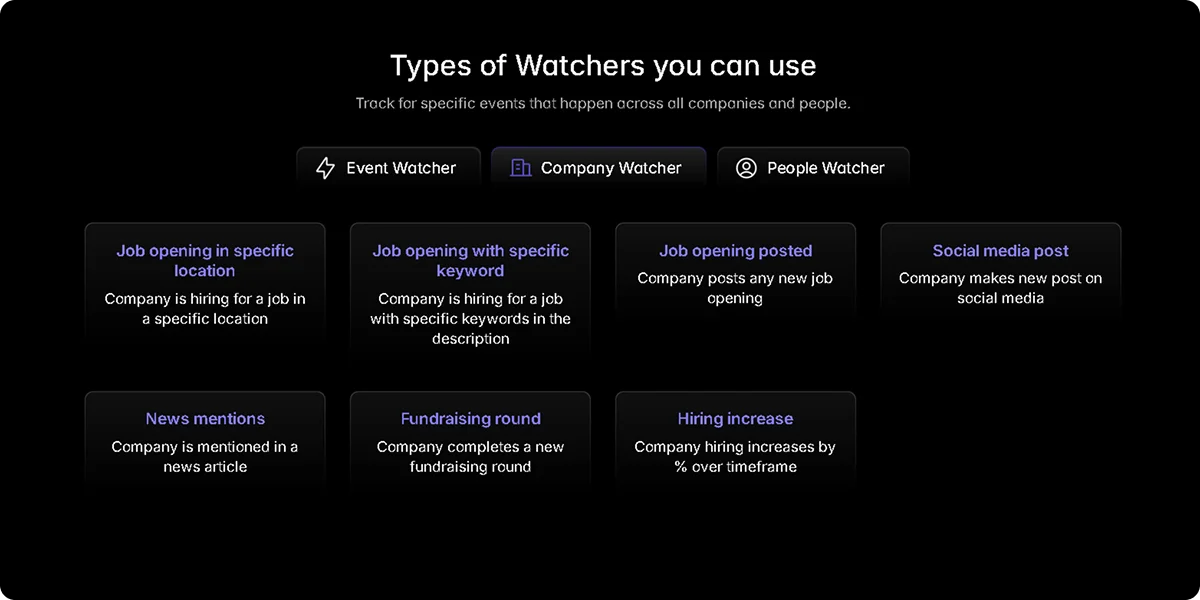
Crustdata's Watcher API monitors a defined account set and fires a webhook the moment a relevant signal occurs:
New funding rounds
Executive hires in key functions
Headcount spikes above a defined threshold
Location changes or new office openings
Rather than finding out about these changes during the next scheduled enrichment run, your team gets an alert right away, keeping the firmographic picture current without manual checking.
What Good Firmographic Data Quality Actually Looks Like
A well-maintained firmographic database is not just large. The table below shows what to aim for across each key dimension.
Dimension | Poor state | Good state |
Source coverage | Single provider | Multi-source with waterfall enrichment |
Refresh cadence | Annual | Quarterly minimum; point-of-execution for active workflows |
Revenue data | Single estimate used as a hard filter | Cross-referenced estimates used as a directional signal |
Headcount | Total only | Total plus department breakdown and growth rate |
Industry | Top-level NAICS or SIC code | Sub-vertical with growth and intent signals layered on top |
Growth signals | Not tracked | Headcount growth, hiring velocity, funding recency |
The best firmographic data providers combine first-party signals from your CRM with third-party enrichment to cover gaps. First-party data tells you what a company has done with you. Third-party enrichment tells you what the company looks like right now, and what signals suggest a buying window is opening.
How Crustdata Supports Firmographic Data Accuracy
The core problem with the accuracy of firmographic data is timing, not a lack of data. Most enrichment workflows pull from a stored database, which means the record your pipeline acts on may already be incorrect by the time it reaches it. Crustdata approaches this differently by crawling verified sources at the moment of each request rather than serving cached results.
This matters most for the fields that change fastest. Funding stage, headcount, and growth rate are the attributes teams use to qualify accounts and set deal size expectations. When those fields are pulled live, a company that restructured last month or closed a round last week shows up with its current profile, not the one from the last database refresh.
For each company in your results, Crustdata returns:
Firmographic data: Covers industry, headcount, revenue range, headquarters, and company type
Headcount growth percentages: Tracks changes across six-month, one-year, and two-year windows
Funding signals: Surfaces total investment raised, funding stage, and most recent round date
Web traffic trends and employee skill distribution: Indicates company scale and growth trajectory
Technographic signals: Pulls tool usage from job postings and company descriptions
95+ company filters and 20+ people filters: Builds hyper-targeted prospect lists based on live data
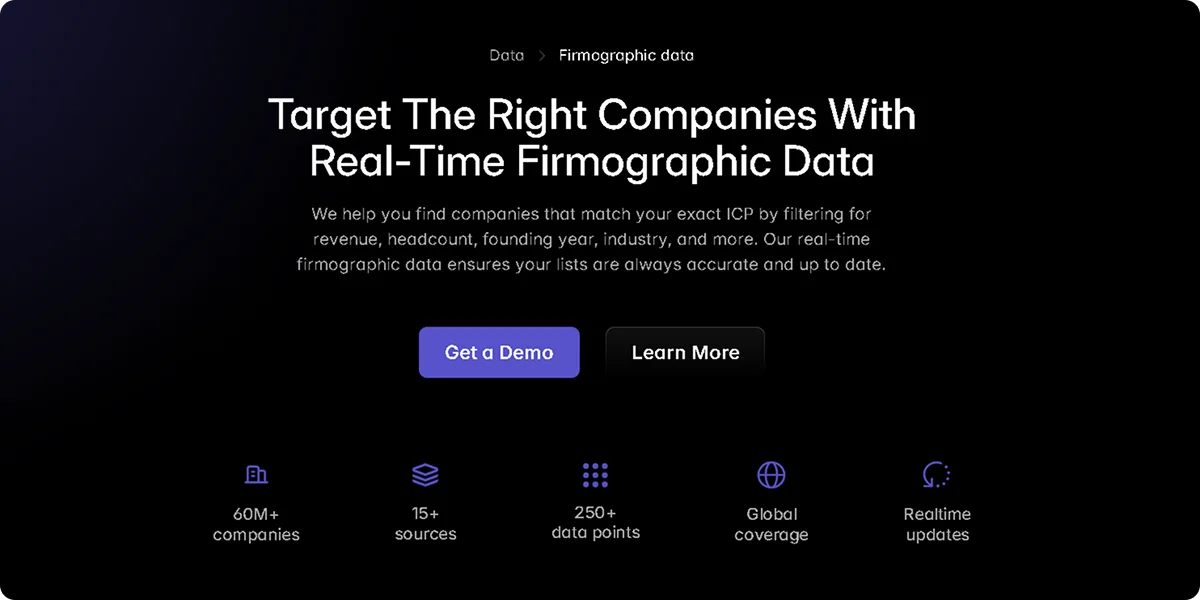
Real-time company enrichment APIs: Turns a company name or domain into a full profile with 250+ data points from 10+ verified sources
Beyond search, the Watcher API lets you define a set of target accounts and receive a webhook alert the moment a qualifying event occurs. For revenue teams tracking accounts against specific firmographic thresholds, this removes the gap between when something changes at a company and when your team finds out.
If you’re running automated prospecting pipelines where a single outdated attribute can route an account to the wrong rep or sequence, the combination of live enrichment and event-triggered alerts removes the two biggest sources of firmographic inaccuracy from the workflow entirely.
Want to see how accurate your current firmographic data actually is against live signals?
Book a demo to see how Crustdata's enrichment and Watcher APIs close the gap.
Frequently Asked Questions
How do you test a firmographic data provider before buying?
Request a sample that matches your ICP. Run it against accounts you already know well and check whether key fields like headcount, industry, funding stage, and revenue range hold up. Also, check fill rate: what percentage of records have those fields populated at all.
Why is revenue data for private companies so unreliable?
Private companies are not required to report revenue publicly, so providers estimate it using employee count, industry benchmarks, funding history, and web traffic data. These estimates can vary between providers for the same company.
Treat private company revenue as a directional signal rather than a hard filter, and cross-reference it against funding stage and hiring velocity before using it to qualify an account.
What is the difference between firmographic data accuracy and firmographic data freshness?
Accuracy refers to whether a data point correctly reflects reality at the time it was collected. Freshness refers to how recently that data point was verified. A record can be accurate when enriched, but stale three months later because the underlying reality has changed.
Both matter: inaccurate data leads to incorrect targeting decisions, and stale data leads to decisions based on a company's past state rather than its current one.


Products
Popular Use Cases
Competitor Comparisons
Use Cases
95 Third Street, 2nd Floor, San Francisco,
California 94103, United States of America
© 2026 Crustdata Inc.
Products
Popular Use Cases
Competitor Comparisons
Use Cases
95 Third Street, 2nd Floor, San Francisco,
California 94103, United States of America
© 2025 CrustData Inc.
Products
Popular Use Cases
Competitor Comparisons
Use Cases
95 Third Street, 2nd Floor, San Francisco,
California 94103, United States of America
© 2026 Crustdata Inc.